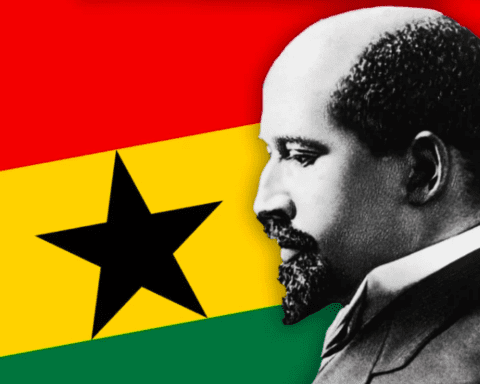
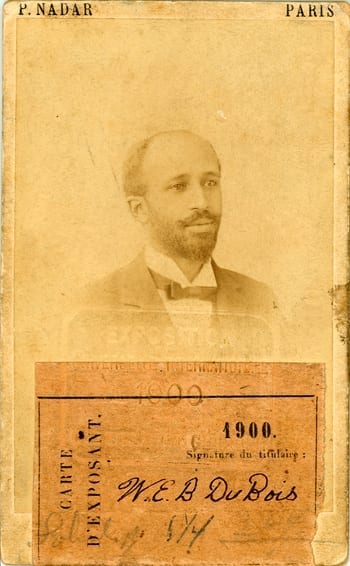
Much has been written on W. E. B. Du Bois and the 1900 Paris Exposition, much of it repetitive, lacking new or innovative considerations of what can be explored and how to critically engage further the work of Du Bois and his team.
The editors – Whitney Battle-Baptiste and Britt Rusert, both scholars at the University of Massachusetts at Amherst – of this present volume W. E. B. Du Bois’s Data Portraits: Visualizing Black America, The Color Line at the Turn of the Twentieth Century – on the 150th anniversary year of the scholar’s birth – collects and publishes in a single volume, Du Bois’s attempt at voicing the progress and conditions blacks in the United States at the turn of the century through the charts and graphs of the American Negro Exhibit.
They give renewed attention to the possible impacts this (re)production might have on knowledge production and transformation in social science discourse. As they note in the introduction, “this is the first time that the data visualizations are collected together in book form and reproduced in full color” (p. 12). Thus, the volume is an offering and a celebration of the work to remind us of the continued necessity to give voice to the progress and struggle for place in the larger narrative of world history.
Before we are allowed to encounter or examine the infographics, there are two short essays by Aldon Morris, the Leon Forrest Professor of Sociology and African American Studies at Northwestern University, and Mabel O. Wilson, Professor of Architecture, Planning and Preservation and Senior Fellow in the Institute for Research and African American Studies at Columbia University, offering, in part, a history of the 1900 exposition in Paris.
However, considerable departures suggesting other motives, strategies and techniques Du Bois used to complete the exhibit and engage his audience. Moreover, the essays speak to the meaning of his work to the academy and the culture.
Morris suggests that Du Bois’s innovations might inspire an upscaling of research and theorization in contemporary visual sociology, as Wilson focuses primarily on the history and geographic thinking that Du Bois and his team dared to proffer about African Americans on the world stage.
As Morris writes, “The exhibit violated white thoughts about black people, especially Americans only three decades removed from slavery” (p. 24).
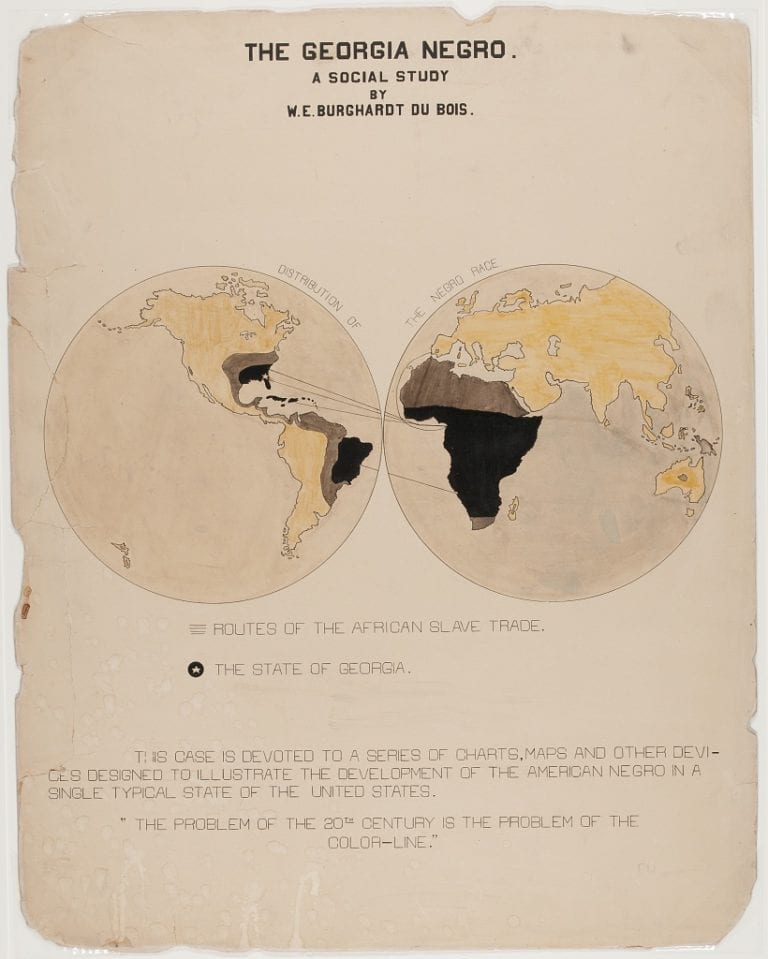
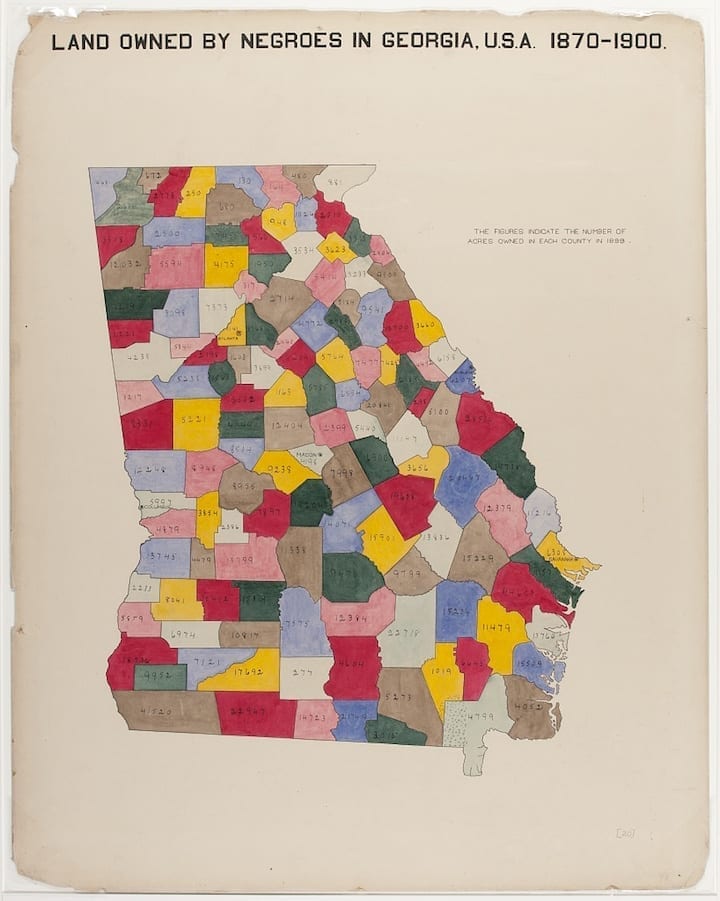
The display in and of itself was a challenge to white supremacy and calls for continued growth and uplift of African people. Wilson discusses Du Bois’s use cartography (“Western methods”) as a way of “inscribing the black world back into history and geography.” The display of the infographics in such a manner, tackling such subjects with such a radicalized visual voice, is consequential of Du Bois having been among the top social scientists of the day, as Morris asserts.
The essays sufficiently guide, or better, give us a proper footing with which to examine the diagrams and charts introduced by Silas Munro, Assistant Professor at the Otis College of Art and Design. Munro, as did Morris and Wilson, discusses Du Bois’s innovations with using the “visual form to make arguments for the equality and sophistication of black Americans living under Jim Crow and the shadow of enslavement” (p. 46), and his place in the overall history of data visualization techniques.
It is noted that although the exhibit was award winning, it was not successful in impacting the audience in attendance, given the lack of discussion of the African American exhibit in the newspapers, at home and abroad.
However, we find here in Munro’s introduction that Du Bois and his students’ graphics might have influenced the rise of artistic movements and the use of data visualizations in Europe and Russia. Munro noted, “The colors, shapes, and typography of the charts also foreshadow critical developments in the history of data visualization, including simplified pictographic form defined in the Isotype picture language, minimal typographic palettes used by the International Typographic Style, and visual narratives in chart form explained in the research of Edward Tufte” (p. 47 & 49).
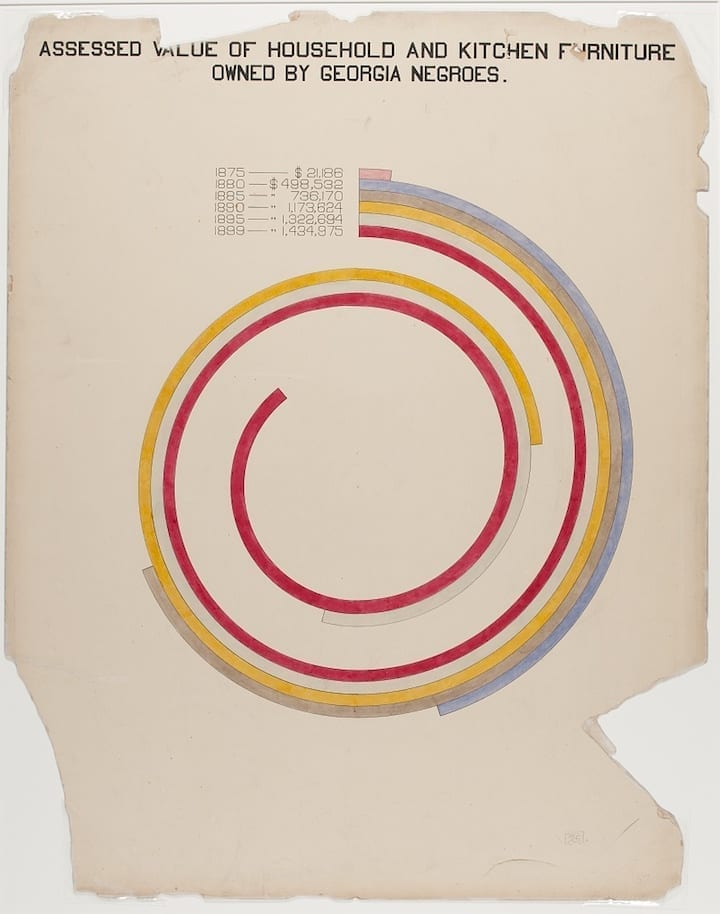
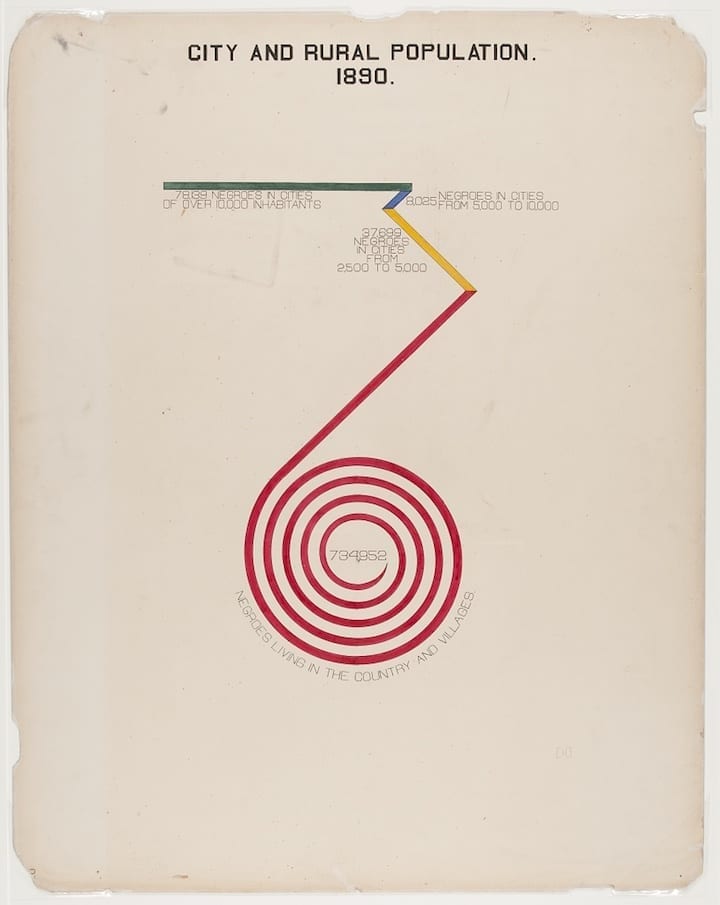
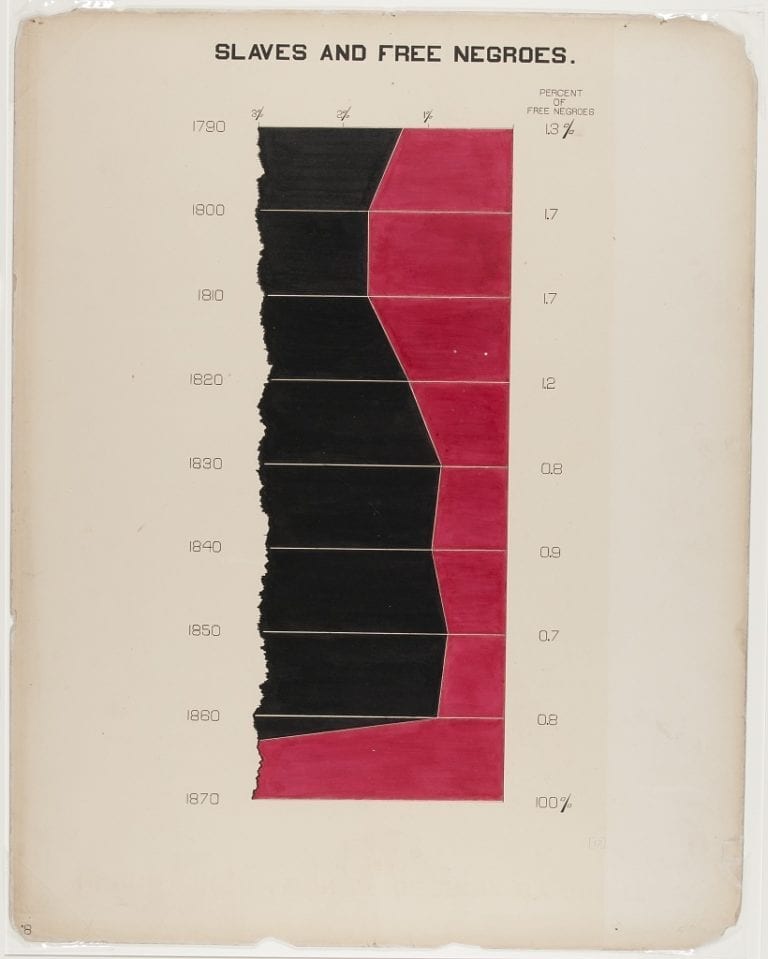
As such, the (re)presentation of the The Georgia Negro: A Social Study by W. E. B. Du Bois follows with a descriptive blurb for each graphic also by Munro. Munro’s descriptions are sufficient; however, of those that he cannot describe and struggle to find meaning is more indicative of the need for a return to Du Bois’s infographics. Inquiries are needed to decipher, explain, and, perhaps, replicate these findings in scientific investigations.
Battle-Baptiste and Rusert conclude their introductory chapter discussing the intellectual impacts of the graphics used for the American Negro exhibit, writing “While we can’t know what future plans Du Bois had for the infographics, we do know that they might take on a new life today, from inspiring forms of design and art-making connected to social justice work to their traction within digital projects and other initiatives that are, like Du Bois and his collaborators, envisioning how data might be re-imagined as a form of accountability and even protest in the age of Black Lives Matter” (p. 22).
Then, this offering of the data portraits at this time is a call to contemporary scholars in the academy to study and engage Du Bois’s methods deeply for improved analyses, meaning making, and social action toward the improvement of the lives of people of African descent as Du Bois intended.
Contributed by Weckea Dejura Lilly
Mr. Lilly is a Research Archivist at the Historical Society of Pennsylvania. In his free time, he experiments with writing short stories and (auto)biographical essays.